Good hospital energy management starts with an uncomfortable fact: most hospitals know how much energy they buy, but far fewer know where it ends up. Meters report what the site or a plant consumes. The building management system (BMS) reports whether the air handling units are running. What usually remains unknown is whether the rooms those systems serve were actually in use, and what the conditions inside them were. This article looks at where energy goes in a hospital, why heating, ventilation and air conditioning (HVAC) dominate, which operating mistakes keep consumption high, and how room-level data helps estates teams act without compromising patient areas or hygiene requirements.
Key points
- Hospitals are among the most energy-intensive buildings. In US survey data, inpatient healthcare buildings had the highest space heating and ventilation intensities of all commercial building types [1].
- Heating, ventilation, water heating and cooling together account for about 63 per cent of energy use in US healthcare facilities [3]. HVAC is where hospital energy management has to look first.
- A large share of avoidable consumption comes from operation, not equipment: plant running around the clock for rooms that are used only part of the day, set points nobody has reviewed, and systems that no longer match how a space is used [9].
- Meters and the BMS answer “how much” and “is it running”. Room data answers “was the room in use, and were conditions right”. Effective energy management needs all three.
- Specialised ventilation areas such as theatres, critical care and isolation rooms follow their own standards (HTM 03-01 in England, ASHRAE 170 in the US, DIN 1946-4 in Germany). Any change there belongs with the infection prevention team and the authorising engineer [6][7].
Why hospital energy management is different
Offices close at night. Schools close for the summer. Hospitals do neither. Wards are occupied 24 hours a day, 365 days a year, and many clinical areas need defined air change rates, pressure regimes and temperatures. The US Energy Information Administration (EIA) attributes the high energy intensity of large hospitals to round-the-clock operation, high occupancy and sophisticated HVAC systems, along with energy-hungry equipment such as sterilisers, laboratory equipment, servers and refrigeration [2].
The numbers reflect that. A peer-reviewed analysis of US healthcare facilities put the average energy use intensity of hospitals at 738.5 kWh per square metre, against 329.3 kWh per square metre for commercial buildings overall and 246 kWh per square metre for a typical office [3]. The same paper notes that European hospitals in the studies it reviewed used less on average, about 333 kWh per square metre, so climate, building stock and operating practice clearly matter [3].
Hospital energy is also a carbon issue. In England, the health and care system is responsible for an estimated 4 to 5 per cent of the country’s carbon footprint, and the NHS has committed to reaching net zero for the emissions it controls directly by 2040 and for those it can influence by 2045 [5]. Estates and facilities are one of the areas the NHS net zero work examines [5]. Whatever the motivation – budget, carbon targets or regulation – the starting point is the same: understanding where the energy goes.
Hospital HVAC energy use: the biggest lever
When hospital estates teams ask where to reduce hospital energy consumption, the answer usually begins with HVAC. In the EIA’s 2018 Commercial Buildings Energy Consumption Survey, space heating was the largest single end use in inpatient healthcare buildings at 32 per cent [1]. The Bawaneh study breaks down healthcare energy further: space heating 29 per cent, ventilation 12 per cent, water heating 11 per cent and cooling 11 per cent [3].
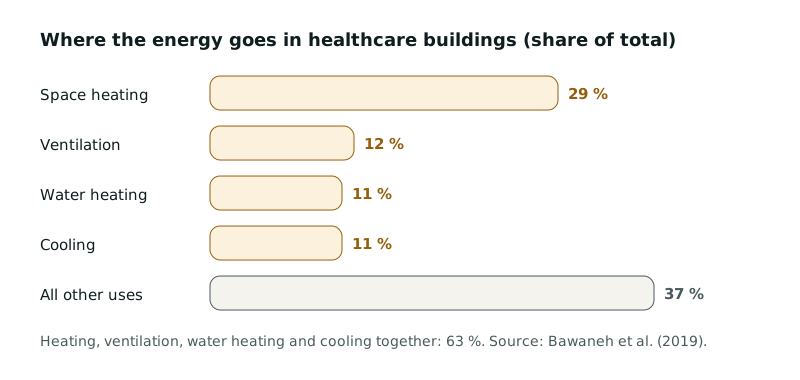 Figure 1: Energy end uses in US healthcare facilities. Heating, ventilation, water heating and cooling make up about 63 per cent of the total. Sources: [3].
Cost tells a slightly different story from quantity. A German study of hospital energy use found that electricity made up only about 20 per cent of the energy a hospital uses but around 50 per cent of its energy costs [4]. Fans, chillers, pumps, lighting and IT all run on electricity, so a ventilation system running longer than necessary costs more than its share of kilowatt-hours suggests. The same study described ventilation and air conditioning systems as responsible for a large part of electricity use, while noting that the electricity consumption of individual devices and systems was almost entirely unknown in the hospitals it examined [4].
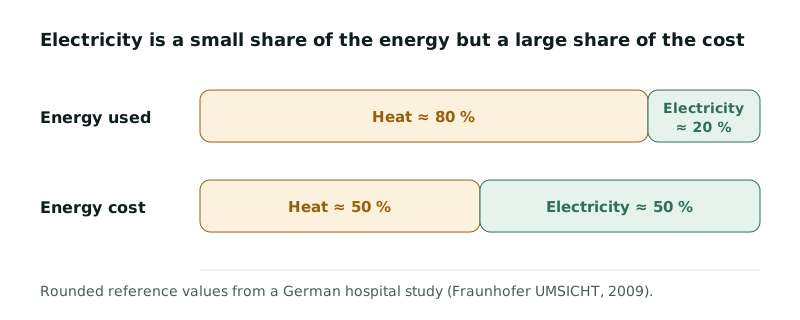 Figure 2: Electricity and heat as a share of energy quantity and energy cost in a hospital (rounded reference values). Sources: [4].
That last point matters. If an estates team cannot say which plant serves which rooms and when those rooms are used, any change to ventilation or heating becomes a leap of faith – and in a hospital, few people are willing to take one near a ward.
Where the waste usually hides
Not all hospital energy use is avoidable. Patient rooms are occupied day and night, and clinical areas have fixed requirements. But published guidance and project reports point to recurring patterns where energy is spent without any room benefiting.
Plant running longer than the space is used
Many systems run around the clock even though the spaces they serve are used only part of the day: offices, outpatient clinics, therapy rooms, staff changing areas, seminar rooms. A German hospital climate programme (KLIK), in which 51 hospitals and rehabilitation clinics took part, reported one example in which the ventilation for a staff changing area was switched from 24-hour operation to 5:00–22:00, saving around 59 MWh a year [9]. The programme’s guidance stresses that not every plant needs to run 24 hours and that actual usage times should be established first [9].
Set points nobody has revisited
Temperatures for corridors, stores, plant rooms and server rooms are set at commissioning and then left alone. In the KLIK programme, technical staff lowered base temperatures in corridors, stairwells and basements during heating walk-rounds, and server room set points were raised from 18 °C to 24 °C in agreement with IT [9]. None of this touches patient rooms.
Spaces that changed use
Hospitals are constantly reconfigured. A consulting room becomes an office; a ward becomes a day unit. The ventilation and heating often stay as they were, so airflow, temperatures and operating hours no longer match the actual use of the space.
Solar gain fought with cooling
South- and west-facing rooms heat up on sunny afternoons. Where cooling exists, it works against heat that external shading could have kept out. Without room-level readings, it is hard to tell which rooms are affected and whether the cause is orientation, equipment or use.
Data that never meets
Meter data, BMS logs and the occasional standalone sensor live in different systems with different owners. Unless they are tied to rooms and to how those rooms are used, they remain numbers that nobody analyses.
Three layers of data for energy management
Hospital energy management is often reduced to meter reading. For operational decisions, three layers need to fit together.
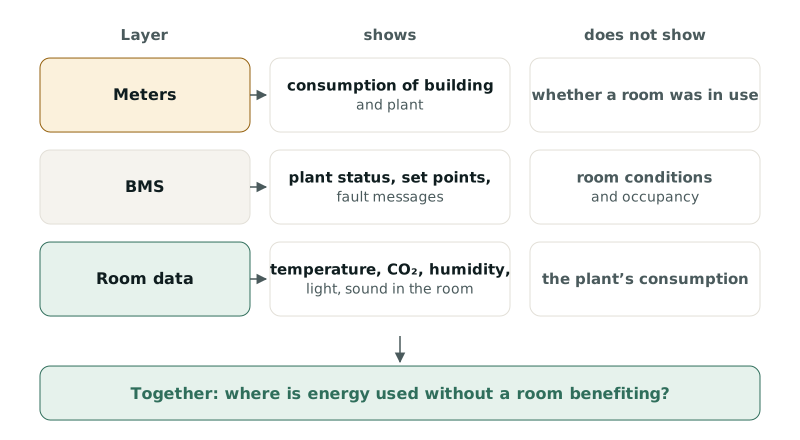 Figure 3: Meters, the BMS and room data answer different questions. Only together do they show where energy is used without a room benefiting. Sources: [3][4].
Meters show how much heat and electricity the site, a building or a plant uses. They are the backbone of any energy reporting and of the energy management systems that larger organisations in the EU must implement: under the recast Energy Efficiency Directive, enterprises whose average annual energy consumption over the previous three years exceeds 85 TJ must have a certified energy management system by 11 October 2027, and those above 10 TJ without one must carry out an energy audit at least every four years [8].
The BMS knows plant status, set points, schedules and alarms. It can tell you that an air handling unit ran at full speed overnight. It usually cannot tell you whether anyone was in the rooms it served.
Room data comes from sensors that measure temperature, humidity, CO₂, light or sound in the room itself. A CO₂ profile shows whether and how intensively a room was occupied; temperature shows whether it was over- or under-supplied. EN 16798-1 provides a recognised framework for indoor environmental parameters covering air quality, thermal environment, lighting and acoustics [10].
The EU is moving in the same direction. The recast Energy Performance of Buildings Directive requires, where technically and economically feasible, building automation and control systems in non-residential buildings with heating, air-conditioning or combined ventilation systems above 290 kW (by the end of 2024) or 70 kW (by the end of 2029) that continuously monitor, log, analyse and allow adjustment of energy use and, from 29 May 2026, monitor indoor environmental quality [11]. In other words, energy and room conditions are meant to be looked at together.
Reduce hospital energy consumption step by step
A hospital energy audit does not have to start with the whole estate. A staged approach produces early insights without disrupting wards.
| Step | What happens | What it needs |
|---|---|---|
| 1. Choose areas | Start where energy use is high and use is unclear: offices, outpatient clinics, day rooms, waiting areas, therapy rooms, mixed-use floors | Floor plans, room schedules |
| 2. Gather existing data | Meter readings, BMS exports, plant schedules | Access to meters and the BMS |
| 3. Measure the gaps | Temperature, CO₂, humidity and light in selected rooms for several weeks, weekdays and weekends, day and night | Plug-in room sensors, network connection |
| 4. Compare | When did the plant run, when was the room in use, what were the conditions? | Data mapped to rooms |
| 5. Prioritise | Rank measures by effect, effort and risk; clinical and specialised areas only with the infection prevention team | Estates, clinical and IPC input |
| 6. Act and verify | After each change, check that room conditions stayed within the agreed range | Continued room data |
Table 1: A staged approach to finding operational savings. Sources: [4][9].
The value of step 6 is easy to underestimate. Changes to heating or ventilation often get reversed after the first complaint. If room data shows that conditions stayed within the agreed range, the discussion becomes factual rather than anecdotal.
Worked example (illustrative)
Worked example (illustrative), assumptions: a ventilation system serving a block of offices and seminar rooms draws an average of 15 kW of fan power when running. Room data shows the spaces are occupied on weekdays from roughly 07:00 to 19:00. If the system currently runs 24 hours a day, every day, it runs 8,760 hours a year. Running it 12 hours on weekdays only (about 3,130 hours a year) would reduce fan run time by around 5,630 hours, equivalent to roughly 84 MWh of fan electricity a year at constant load. Real results depend on the plant, its control strategy, heat recovery, minimum ventilation requirements and how the spaces are actually used, and must be assessed on site; this example is not a promise for any building.
Care home energy costs and other healthcare settings
The same logic applies beyond acute hospitals, with different emphases. In care homes, residents live in the building permanently and their rooms are their homes. Here the main levers are heating matched to occupancy in shared areas and ventilation at the right times, without making residents’ rooms less comfortable. Rehabilitation clinics follow a weekly rhythm of therapy sessions, arrivals and departures, which makes scheduling an obvious first step. Medical practices and health centres have evenings and weekends when rooms are empty but often still fully heated or ventilated.
How Fact & Feeling helps
Fact & Feeling measures room conditions – not people, not patients and not medical devices. Sensors record CO₂, particulate matter, volatile organic compounds (VOCs), temperature, humidity, light and sound in selected rooms and send the readings over Wi-Fi to an AI platform. There you see every room on the floor plan, with live values, trends, issues and hints.
For hospital energy management, these services are the most relevant:
- Audit and analysis to reduce hospital energy consumption: for a limited period we measure in selected areas, combine the readings with your existing data and floor plans, and analyse them. You get a report that marks unusual rooms, times and plant on the floor plan and lists possible measures ordered by impact and effort.
- Energy monitoring for hospitals around the clock: the devices stay, and the platform shows continuously when rooms leave their target range, with regular reports per area.
- Healthcare energy management software that works room by room: one platform for every room, combining existing data with devices only where measuring points are missing.
- Hospital HVAC energy use and automation: where ventilation, heating, lighting or sun shading are connected, the platform can control them within limits your facility sets. Sensitive areas stay with recommendations, and your team decides.
What Fact & Feeling does not do: it does not promise specific savings, it does not replace an energy audit, an energy consultant or design engineers, and it does not make decisions about hygiene or infection prevention requirements. Whether and how much can be saved depends on your building and only shows up in your own data. For residential care settings, see our page on care home energy costs and room conditions.
Limits and risks
Energy work in a hospital touches areas that other specialists are responsible for. Draw these boundaries early:
- Infection prevention and specialised ventilation: theatres, critical care, isolation rooms and sterile services follow specialised ventilation guidance – in England HTM 03-01, in the US ASHRAE 170, in Germany DIN 1946-4 – and the requirements of your infection prevention and control team [6][7]. Any setback of airflow or operating hours there is only conceivable with the infection prevention team, the authorising engineer and within the standard. Room data provides information for that discussion, not a hygiene assessment.
- Medical equipment and safety: systems that serve medical equipment, data centres or safety functions belong to medical engineering, IT and the duty holder. Room data is not an alarm system and does not replace safety-related monitoring.
- Comfort and health: patient room temperatures should not be lowered simply because it saves energy on paper. Complaints from patients or staff go to ward management and, where relevant, clinical staff.
- Energy advice and design: investment in plant, fabric or energy supply needs an energy consultant and design engineers. Room data can support their work but does not replace it.
- Regulation: obligations under national energy efficiency or building laws should be checked with your legal team or adviser. This article is general information, not legal advice (status: October 2026).
- Data quality: readings are only as good as sensor placement and the mapping to rooms. Planning measuring points carefully is part of every analysis.
Frequently asked questions
What is hospital energy management?
Hospital energy management is the systematic process of measuring, analysing and improving how a hospital uses energy. It combines meter data, plant data from the BMS and, increasingly, data on room conditions and occupancy, so that energy is used where and when rooms need it.
Why do hospitals use so much energy?
Hospitals operate 24 hours a day, have high occupancy, need sophisticated HVAC systems and run energy-intensive equipment such as sterilisers, laboratory equipment, servers and refrigeration [2]. In US data, hospitals used about 738.5 kWh per square metre on average, well above other commercial buildings [3].
How can hospitals reduce energy consumption without affecting patients?
By starting where energy is used without any room benefiting: plant schedules for offices, clinics and support areas, set points in corridors and stores, lighting in empty rooms. Patient rooms stay within the agreed range. Room data shows beforehand where the scope lies and afterwards whether conditions remained stable.
What share of hospital energy goes on HVAC?
It varies by building and climate. In a peer-reviewed analysis of US healthcare facilities, space heating, ventilation, water heating and cooling together made up about 63 per cent of energy use [3].
What should a hospital energy audit include?
At a minimum: a breakdown of consumption by energy carrier and major plant, operating schedules compared with actual use, a review of set points, and a ranked list of measures. Adding room-level measurements shows whether plant operation matches occupancy and room conditions.
Is energy monitoring for hospitals the same as a BMS?
No. A BMS controls and monitors plant. Energy monitoring tracks consumption over time and relates it to use. Room-level monitoring adds what happens in the rooms themselves. They complement each other.
What is healthcare energy management software?
Software that brings together energy data – meters, BMS points, sensors – and presents it so that estates and energy managers can find anomalies, compare sites and track the effect of measures. Its usefulness depends on whether the data is mapped to rooms and how those rooms are used.
Do care homes face the same energy issues as hospitals?
Partly. Care homes also run day and night, but residents live there permanently, and comfort in their rooms has priority. The main levers for care home energy costs are usually heating and ventilation matched to how shared areas such as dining and day rooms are used.
Sources
- U.S. Energy Information Administration (n.d.): Commercial Buildings Energy Consumption Survey 2018 – Health care buildings. https://www.eia.gov/consumption/commercial/pba/health-care.php
- U.S. Energy Information Administration (2012): Large hospitals tend to be energy-intensive. Today in Energy. https://www.eia.gov/todayinenergy/detail.php?id=7670
- Bawaneh, K., Ghazi Nezami, F., Rasheduzzaman, M., Deken, B. (2019): Energy Consumption Analysis and Characterization of Healthcare Facilities in the United States. Energies 12(19), 3775. https://www.mdpi.com/1996-1073/12/19/3775
- Beier, C. / Fraunhofer UMSICHT (2009): Analyse des Energieverbrauchs und exemplarische Best-practice-Lösungen für relevante Verbrauchssektoren in Krankenhäusern (Analysis of energy consumption in hospitals). https://www.umsicht.fraunhofer.de/content/dam/umsicht/de/dokumente/kompetenz/energie/energieverbrauch-krankenhaus-abschlussbericht.pdf
- NHS England (n.d.): Delivering a net zero NHS. https://www.england.nhs.uk/greenernhs/a-net-zero-nhs/
- NHS England (2021): Health Technical Memorandum 03-01: Specialised ventilation for healthcare premises. https://www.england.nhs.uk/publication/specialised-ventilation-for-healthcare-buildings/
- ASHRAE / ASHE (2021): ANSI/ASHRAE/ASHE Standard 170-2021, Ventilation of Health Care Facilities. https://www.ashe.org/standard170
- European Union (2023): Directive (EU) 2023/1791 on energy efficiency (recast), Article 11. https://eur-lex.europa.eu/eli/dir/2023/1791/oj/eng
- BUND Berlin e. V. / KLIK project (2016): Klimaschutz in Kliniken verankern (Embedding climate protection in hospitals). Guide. https://www.klimaschutz.de/sites/default/files/klik_leitfaden.pdf
- DIN EN 16798-1:2022-03 (EN 16798-1:2019): Energy performance of buildings – Ventilation for buildings – Part 1: Indoor environmental input parameters for design and assessment of energy performance of buildings addressing indoor air quality, thermal environment, lighting and acoustics. DIN Media. https://www.dinmedia.de/de/norm/din-en-16798-1/349622591
- European Union (2024): Directive (EU) 2024/1275 on the energy performance of buildings (recast), Article 13. https://eur-lex.europa.eu/eli/dir/2024/1275/oj/eng