Hospital indoor air quality is designed with care and then rarely measured. Ventilation is specified to standards, commissioned and handed over. After that, most estates teams see supply and extract readings in the building management system, and nursing staff notice when a bay feels stuffy, a side room overheats in the afternoon or a ward is loud at night. Patients spend days or weeks in rooms they can hardly control, and staff work in the same rooms around the clock. This article looks at the room parameters behind indoor environmental quality: temperature, humidity, CO₂ as an indicator of ventilation, particles, sound and light. It sets out what standards, public health bodies and studies say, why design values and measured reality drift apart, and what continuous room data can and cannot show.
Key points
- Hospital indoor air quality is one part of indoor environmental quality (IEQ), alongside thermal comfort, acoustics and light. For most parameters there are reference values, such as WHO noise guidance for hospital wards and German CO₂ guide values [7][4].
- Measurement studies show that hospitals rarely meet WHO noise recommendations, including at night [8][9].
- Design values describe how a room should perform. Only measurement over days, nights and seasons shows how it does perform.
- Room data describes rooms, not people. It replaces neither clinical judgement nor infection prevention and control (IPC) assessment. Specialised ventilation follows HTM 03-01, ASHRAE 170 or national equivalents [2][3].
Hospital indoor air quality within indoor environmental quality
Indoor environmental quality in healthcare is the umbrella term researchers and planners use. A 2024 systematic review in the Journal of Building Engineering names daylighting, thermal comfort, acoustics and indoor air quality as its elements. According to the review, the studies it covers associate favourable IEQ with patient recovery, lower stress and shorter stays, while the combined effects of these factors are little studied [1]. These are associations across groups of patients, not evidence of what a specific change will achieve in a specific building.
For running a hospital, a simpler question matters more: what are conditions actually like on our wards, room by room, day and night? For hospitals and clinics, that question is where improvement starts.
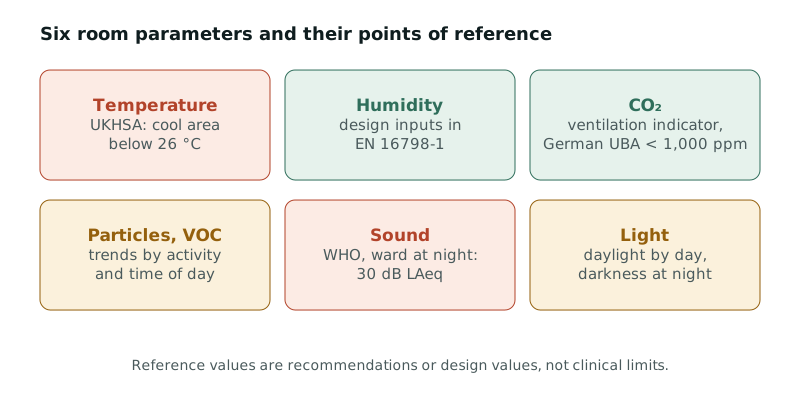 Figure 1: Six room parameters and their points of reference. Sources: [4][7][12][14].
Standards that shape the patient room
In England, Health Technical Memorandum 03-01 covers specialised ventilation for healthcare premises: legal requirements, design, maintenance and operation in acute settings, as the standard for new installations and major refurbishments [2]. In the United States, ANSI/ASHRAE/ASHE Standard 170-2025, Ventilation of Health Care Facilities, sets minimum requirements for healthcare ventilation and offers guidance, regulation and mandates to designers and operators, including ventilation tables by space type and filtration requirements [3]. Germany uses DIN 1946-4 for ventilation in healthcare buildings [15]. Readers looking for ASHRAE 170 patient room requirements should consult the standard itself; this article uses these documents for terminology, not to restate their tables.
For general indoor spaces, the European standard EN 16798-1 defines indoor environmental input parameters for design and assessment, explicitly covering indoor air quality, thermal environment, lighting and acoustics [14].
The six parameters and what the references say
Temperature
Temperature is what people notice first. For housing, the WHO considers 18 °C a safe and well-balanced indoor temperature in the cold season in temperate or colder climates [11]. For heat, the UK Health Security Agency (UKHSA) notes that high-risk groups can struggle to cool down once temperatures rise above 26 °C. It advises care settings to provide a cool room or area that can be kept below 26 °C, and to check and record indoor and outdoor temperatures regularly in hot periods [12]. In Germany, the federal model heat protection plan for hospitals recommends a floor plan showing the most affected areas, moving vulnerable patients to cooler rooms during heat warnings and closing particularly hot rooms; it does not set a fixed temperature limit for patient rooms [13].
Humidity
Relative humidity varies with season, ventilation and heating. In heated rooms in winter it is often low; in bathrooms and assisted bathrooms after use it can be high. Persistently high humidity matters mainly for the building fabric because it can favour mould. In specialised ventilation, humidity is governed by the applicable standard [2][3][15].
CO₂ as an indicator of ventilation
People exhale CO₂. Its concentration shows how much exhaled air has built up in a room and is therefore an indicator of ventilation under occupancy. Germany’s committee on indoor air guide values at the Federal Environment Agency classes concentrations below 1,000 ppm as hygienically unobjectionable, 1,000 to 2,000 ppm as hygienically conspicuous, with a recommendation to improve ventilation, and above 2,000 ppm as hygienically unacceptable [4].
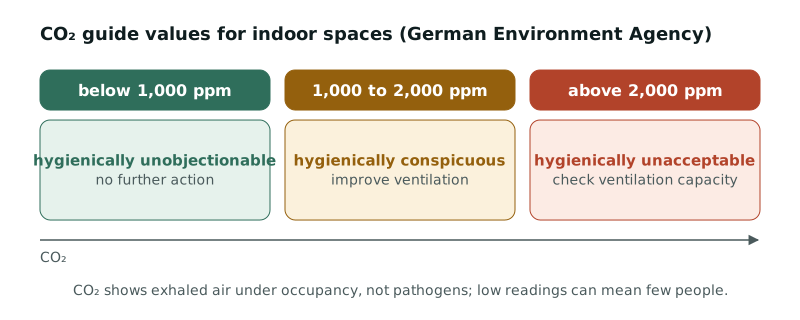 Figure 2: CO₂ guide values for indoor spaces. Source: [4].
Two caveats apply. CO₂ is not a measure of pathogens or pollutants; it measures exhaled air. And the reading depends on occupancy. A measurement study in two UK care homes points out that low CO₂ values may simply indicate that few people are in a space [5]. A University of Leeds project with a hospital trust notes that CO₂ monitors have been widely recommended as a proxy for ventilation, but that there is little application in healthcare environments and the evidence base is very limited [6]. CO₂ monitoring on hospital wards is therefore a useful tool for spotting patterns, not a verdict on ventilation safety.
Particles and VOC
Particles indoors come from movement, cleaning and outdoor air. Volatile organic compounds (VOC) come from cleaning and disinfection products, materials and furniture, among other sources. In healthcare buildings these values are most informative as trends: when do they rise, in which rooms, after which activities? Areas with specific air cleanliness requirements follow the specialised ventilation standards [2][15].
Hospital noise levels
Sound is the most common complaint on many wards. The WHO Guidelines for Community Noise recommend 30 dB LAeq for hospital ward rooms at night, with single events up to 40 dB LAmax, and that 35 dB LAeq should not be exceeded in most rooms where patients are treated, observed or rest [7].
Measurements show how far everyday reality is from this. At Johns Hopkins Hospital, average equivalent sound levels were in the 50 to 60 dB(A) range, no location met WHO guidelines, many units showed little or no reduction at night, and data gathered over 45 years pointed to rising levels [8]. In a study on five adult intensive care units in the UK, average levels always exceeded 45 dB(A); peaks above 85 dB(A) occurred at all sites, up to 16 times an hour overnight, and the lowest overnight average, 51 dB(A), came only at around 4 a.m. [9]. The authors consider the WHO levels not achievable in intensive care [9].
For design, HTM 08-01 sets criteria for noise intrusion from external sources into single-bed wards of 35 dB LAeq,1h and 45 dB LAmax at night (23:00 to 07:00) [10].
Light
Light works in two directions: daylight and adequate lighting by day, darkness and glare-free orientation lighting at night. For indoor workplaces, including staff areas, EN 12464-1 sets lighting requirements [16]. How bright a patient room is at night, and how often lights come on, only a measurement across the night shows.
Table 1: Reference values for room conditions in healthcare buildings (selection)
| Parameter | Reference | Issued by | What it is, and what it is not |
|---|---|---|---|
| CO₂ | < 1,000 ppm unobjectionable; 1,000–2,000 ppm conspicuous; > 2,000 ppm unacceptable | German Environment Agency [4] | Ventilation indicator for indoor spaces; not a measure of pathogens |
| Sound, ward at night | 30 dB LAeq, 40 dB LAmax | WHO 1999 [7] | Recommendation; rarely met in measurement studies [8][9] |
| Noise intrusion from outside, single-bed ward at night | 35 dB LAeq,1h, 45 dB LAmax | HTM 08-01, England [10] | Design criterion for new build and refurbishment |
| Temperature, cold season | 18 °C safe indoor temperature in housing | WHO 2018 [11] | Lower bound for homes, not a comfort target for hospitals |
| Temperature, heat | cool area below 26 °C | UKHSA, for care settings [12] | UK guidance; Germany uses heat protection plans [13] |
| Indoor air quality, thermal, lighting, acoustics | Input parameters for design and assessment | EN 16798-1 [14] | Design basis, not a clinical limit |
| Specialised ventilation | Requirements per space type | HTM 03-01, ASHRAE 170, DIN 1946-4 [2][3][15] | Governing design and operating guidance; IPC decides |
Why design values and measured reality drift apart
A patient room is designed to standards. Then operation begins, with influences no design fully predicts.
Occupancy changes. A four-bed bay with visitors is a different room from an empty side room, while ventilation is usually set for one design case.
Orientation and sun. South- and west-facing rooms get much warmer on summer afternoons than north-facing ones, which is why the German heat plan recommends mapping the most affected areas [13].
Plant ages. Dirty filters, mis-set valves and time schedules nobody has checked for years shift conditions gradually.
Routines create noise. Handovers, cleaning, trolleys and equipment alarms produce peaks that have little to do with building acoustics.
Nobody sees everything. Nursing notices the stuffy bay, estates see the plant, IPC see the inspection. A shared picture is rare.
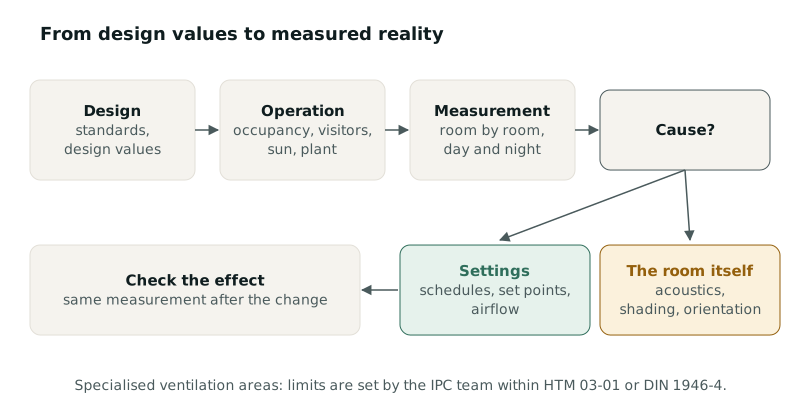 Figure 3: From design values to measured reality, and to the question whether settings or the room itself are the cause. Own illustration based on [2][13][14][15].
Common mistakes
- Measuring only after complaints. A spot check at the wrong time shows nothing; conditions vary across day, night and weekend.
- Looking only at the plant. BMS readings show supply and extract conditions, not necessarily the conditions at the bedside.
- Single readings instead of trends. One high CO₂ value means little. A recurring pattern, every evening at visiting time, means a lot.
- Misreading values. A low CO₂ reading in an empty room does not prove good ventilation [5]. A WHO noise value that intensive care units practically cannot reach [9] works better as a direction than as a pass mark there.
- Treating specialised ventilation areas like general wards. Theatres, critical care and isolation rooms follow HTM 03-01, ASHRAE 170 or national equivalents, and the IPC team [2][3].
Beyond the acute hospital
Table 2: Typical focus by type of facility
| Facility | Typical rooms | Main parameters |
|---|---|---|
| Acute hospital | Single rooms, bays, day rooms | Sound and light at night, CO₂ at full occupancy, summer heat |
| Care home, senior living | Residents’ rooms, dining and lounges, assisted bathrooms | Temperature and heat, humidity in bathrooms, daylight |
| Rehabilitation | Therapy and group rooms, bedrooms | CO₂ and temperature during group sessions, quiet nights |
| Mental health | Bedrooms, quiet and group rooms | Sound, light and temperature as stimuli, day and night |
| GP practice, health centre | Waiting rooms, consulting rooms | CO₂ and warmth when busy |
| Hospice, palliative care | Single rooms, family rooms | Temperature, quiet and light in each room |
Indoor air quality in care homes
For residents, care homes and senior living are home. Many spend most of the day in their own room and cannot operate windows, heating or blinds themselves. Indoor air quality in care homes and room temperatures in residents’ rooms deserve particular attention, especially in hot weather, when UKHSA advises regular temperature checks and a cool area [12].
Mental health wards
Psychiatric ward environment design puts sound, light and temperature in the foreground because they act as stimuli. Psychiatry and psychosomatics settings also need quiet rooms that really are quiet, which is where data on hospital noise levels by zone and time of day helps the team see what is happening. Designers often speak of a “healing environment”; the term describes a design approach, not an outcome that can be promised for a room.
GP practices and waiting rooms
In medical practices and health centres, waiting rooms fill quickly. A CO₂ monitor in a medical practice is a simple way to see when a waiting room needs airing, using guide values such as those in Table 1 [4].
Indoor air quality monitoring for hospitals: setting it up
- Choose representative rooms: different orientations, multi-bed bays, rooms near the nurses’ station, day rooms. Not every room needs a sensor, but the spread should be visible.
- Measure long enough: weekdays, weekends, nights; summer for heat, the heating season for dry air.
- Agree target ranges: estates, nursing and IPC set the ranges per room type, based on standards and references such as Table 1.
- Read trends, not single values: the result is the recurring room and time, not the highest reading.
- Find the cause: settings and operation (schedules, set points, airflows) or the room itself (missing shading, hard acoustics)?
- Check the effect: after a change, the same measurement shows whether anything improved.
How Fact & Feeling helps
Fact & Feeling is the healthcare brand of NodeByNode Systems Design UG in Berlin. Its sensors measure room conditions (CO₂, particulate matter, VOC, temperature, humidity, light and sound) and connect via Wi-Fi. An AI platform shows rooms on the floor plan with live values, trends, issues and hints.
- Platform and devices: indoor air quality monitoring for hospitals and care homes on one platform, with devices only where measuring points are missing and existing BMS data and meters integrated where available.
- Audit and analysis, then monitoring: a measuring phase with analysis per area, after which devices can stay for 24/7 monitoring with regular reports, for example a night profile per ward showing the rooms that stand out repeatedly.
- Automation: where ventilation, heating, lighting or shading are connected, the platform can adjust them within limits the facility sets, or give recommendations. Specialised ventilation areas designed to standards such as ASHRAE 170 or HTM 03-01 stay with recommendations, and the IPC team decides.
- Space and architecture advice: when data shows that the room itself is the cause, for example acoustics or shading, recommendations on indoor environmental quality in healthcare are coordinated with the facility’s planners.
What Fact & Feeling does not do: it measures rooms, not people. It does not diagnose, makes no statements about any individual’s health, does not judge hygiene and does not replace IPC specialists, medical engineering, safety-related alarm systems or manufacturer maintenance. It certifies nothing.
Limits and risks
- Health: Reference values and studies describe associations, not diagnoses. Anyone with health complaints should see a doctor. Whether a room suits a particular patient is for the care team to judge.
- Infection prevention and control: Theatres, critical care and isolation rooms follow HTM 03-01, ASHRAE 170, DIN 1946-4 or the relevant national standard, and the IPC team [2][3][15]. Any change to ventilation there only with the IPC team and within the standard.
- Limits: Many values in this article are recommendations or design criteria, not legal limits for patient rooms. Each facility sets its own target ranges with estates and IPC.
- Measurement: Every measurement has limits; sensor position and height affect readings. Readings are orientation, not certified proof.
- Building changes: Acoustics, shading or layout changes are for planners, architects and contractors.
- Data protection: Room data such as CO₂ or sound levels can indicate presence. Agree access, retention and purpose with the facility’s data protection officer, and for sound measurement also how devices process audio.
Frequently asked questions
What is good indoor air quality in a hospital?
There is no single number. For general rooms, CO₂ below 1,000 ppm is a widely used orientation for adequate ventilation [4], and EN 16798-1 defines input parameters for design [14]. Specialised ventilation areas have their own requirements in HTM 03-01, ASHRAE 170 or national standards [2][3].
What does ASHRAE 170 require for patient rooms?
ANSI/ASHRAE/ASHE Standard 170-2025 sets minimum ventilation requirements for healthcare spaces, with ventilation tables by space type and filtration requirements, addressed to designers and operators [3]. For specific values, refer to the current edition of the standard; requirements differ by space type and jurisdiction.
How loud are hospitals at night?
Studies measured average levels of 50 to 60 dB(A) in one large hospital [8] and averages above 45 dB(A) on intensive care units, with frequent peaks above 85 dB(A) at night [9]. The WHO recommends 30 dB LAeq for ward rooms at night [7].
Is CO₂ monitoring useful on hospital wards?
It shows patterns of ventilation under occupancy and is easy to measure. Researchers note that the evidence base for CO₂ monitoring in healthcare is still limited [6], and low readings can simply mean few people in the room [5]. It does not measure pathogens.
What room temperature should a care home keep in hot weather?
UKHSA advises care settings to have a cool room or area that can be kept below 26 °C and to check and record temperatures regularly during hot periods [12]. Individual needs are for the care team to judge.
Do I need a CO₂ monitor in a medical practice waiting room?
It is not generally required, but it is a simple way to see when a busy waiting room needs airing. Guide values such as the German 1,000 ppm orientation help interpret readings [4].
What is the difference between indoor air quality and indoor environmental quality?
Indoor air quality covers the air: CO₂, particles, VOC, humidity. Indoor environmental quality is broader and also includes thermal comfort, acoustics and light [1].
Sources
- Ackley, A. et al. (2024): Indoor environmental quality (IEQ) in healthcare facilities: A systematic literature review and gap analysis. Journal of Building Engineering 86, 108787. https://openaccess.wgtn.ac.nz/articles/journal_contribution/Indoor_environmental_quality_IEQ_in_healthcare_facilities_A_systematic_literature_review_and_gap_analysis/27160026/1
- NHS England (2021): Health Technical Memorandum 03-01: Specialised ventilation for healthcare premises. https://www.england.nhs.uk/publication/specialised-ventilation-for-healthcare-buildings/
- ASHRAE/ASHE (2025): ANSI/ASHRAE/ASHE Standard 170-2025, Ventilation of Health Care Facilities. https://www.ashe.org/standard170-2025
- German Environment Agency (UBA), Committee on Indoor Air Guide Values (2008, updated 2022): Hygienische Leitwerte für die Innenraumluft – Kohlendioxid. https://www.umweltbundesamt.de/system/files/medien/4031/bilder/dateien/hygienische_leitwerte_0.pdf
- Khaliq, K. A. et al. (2024): Environmental data monitoring and infection risks in UK care-homes in the context of COVID-19. Building and Environment 250, 111174. https://eprints.whiterose.ac.uk/207425/
- University of Leeds: Role of CO2 monitoring to manage ventilation effectiveness in hospital wards (project description). https://fluid-dynamics.leeds.ac.uk/projects/role-of-co2-monitoring-to-manage-ventilation-effectiveness-in-hospital-wards/
- World Health Organization (1999): Guidelines for community noise. https://www.who.int/publications-detail-redirect/a68672
- Busch-Vishniac, I. J. et al. (2005): Noise levels in Johns Hopkins Hospital. Journal of the Acoustical Society of America 118(6), 3629–3645. https://pubmed.ncbi.nlm.nih.gov/16419808/
- Darbyshire, J. L.; Young, J. D. (2013): An investigation of sound levels on intensive care units with reference to the WHO guidelines. Critical Care 17, R187. https://ora.ox.ac.uk/objects/uuid:7205a421-3b33-4211-b358-5b31b18af4e1
- NHS England (2013): Health Technical Memorandum 08-01: Acoustics. https://www.england.nhs.uk/wp-content/uploads/2021/05/HTM_08-01.pdf
- World Health Organization (2018): WHO Housing and Health Guidelines, Chapter 4: Low indoor temperatures and insulation. https://www.ncbi.nlm.nih.gov/books/NBK535294/
- UK Health Security Agency (2025): Supporting vulnerable people before and during hot weather: social care managers. https://www.gov.uk/guidance/supporting-vulnerable-people-before-and-during-hot-weather-social-care-managers
- German Federal Ministry of Health (2024): Musterhitzeschutzplan für Krankenhäuser. https://www.bundesgesundheitsministerium.de/fileadmin/Dateien/3_Downloads/H/Hitzeschutzplan/Musterhitzeschutzplan_Krankenhaeuser_BF.pdf
- EN 16798-1 (DIN EN 16798-1:2022-03): Energy performance of buildings – Ventilation for buildings – Part 1: Indoor environmental input parameters for design and assessment of energy performance of buildings addressing indoor air quality, thermal environment, lighting and acoustics. https://www.dinmedia.de/de/norm/din-en-16798-1/349622591
- DIN 1946-4:2018-09 (amended by DIN 1946-4/A1:2025-11): Ventilation and air conditioning – Part 4: Ventilation in buildings and rooms of health care. https://www.dinmedia.de/de/norm/din-1946-4/294438653
- EN 12464-1 (DIN EN 12464-1:2021-11): Light and lighting – Lighting of work places – Part 1: Indoor work places. https://www.dinmedia.de/de/norm/din-en-12464-1/334047306